By Paul Homewood

The Met Office gleefully declared the hottest start to May on record last Thursday.
This is the usual “One Day = Climate” hooey we are used to seeing from the Met Office, which appears to think we have not worked out there are 364 other days in the year!
In fact a temperature of 29.3C in the London urban heat bubble is not remarkable at this time of year. It was not even as hot as the 16th April was in 1949.

Away from the urban heat island, temperatures only hit 26.1C at Rothamsted, the high quality Class 1 site, thirty miles north in the Hertfordshire countryside.
CET reached 25.4C that day, the sort of temperature not uncommon in the first week of May:
https://www.metoffice.gov.uk/hadobs/hadcet/cet_info_max.html
But much more important than one day’s weather is what the long term trends tell us – and here we have a surprise.
Although average Spring temperatures have been on the rise in recent decades, there has been no upward movement in the highest temperatures set each year in any of the three months:


The chart for March includes this year. April, which is not in, hit a high of 24.5C, and as we have seen the highest so far this month is 25.4C, neither of which are records.
As we always seem to see when we do these sort of analyses, warmer weather tends to be more frequent, and colder weather less so. What we don’t see is an upward shift in all temperature bands.
In other words – WEATHER.
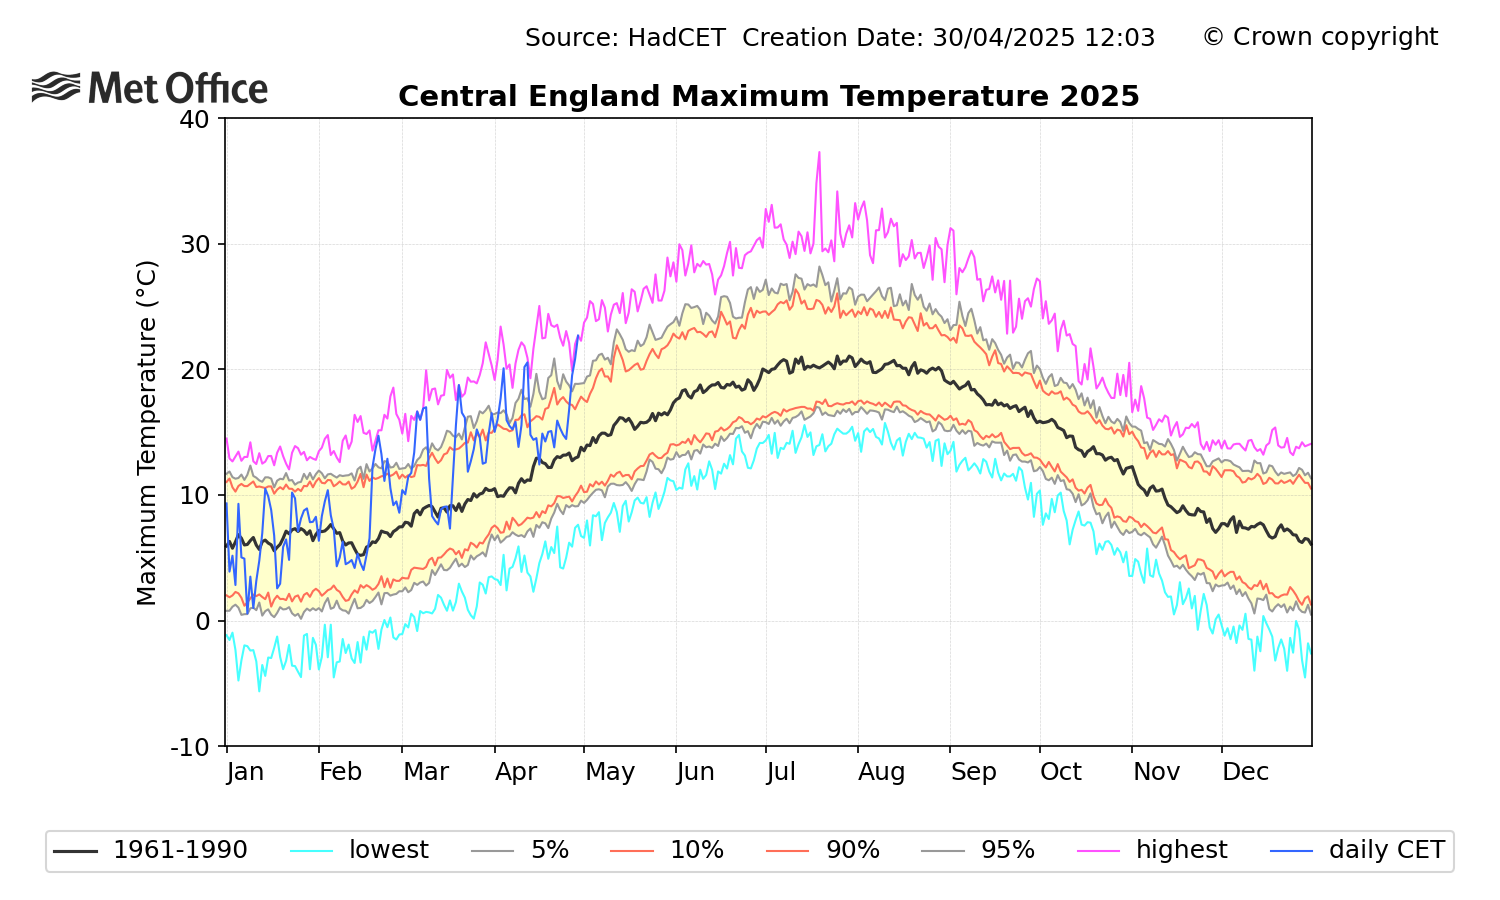
We can see this clearly in the temperatures so far for spring this year:
Virtually every day has been in the top half of the 1961-90 distribution, but none have broken through the ceiling.
It is a truth that the Met Office would rather suppress, as it destroys their “climate change” narrative.
Instead they would rather fool you selecting odd days at some of their junk sites, which should not be used for climatological purposes.