By Paul Homewood
.
Image may be NSFW.
Clik here to view.
https://www.bbc.co.uk/news/world-us-canada-42251921
.
You will recall this graph from the latest piece of BBC disinformation about hurricanes. As I wrote the other day:
“The apparent increase in major Atlantic hurricanes since 1920 is due to the fact that we now have satellites to observe them in mid-ocean. This is why there is a step change in the 1990s.”
This is the full list:
Image may be NSFW.
Clik here to view.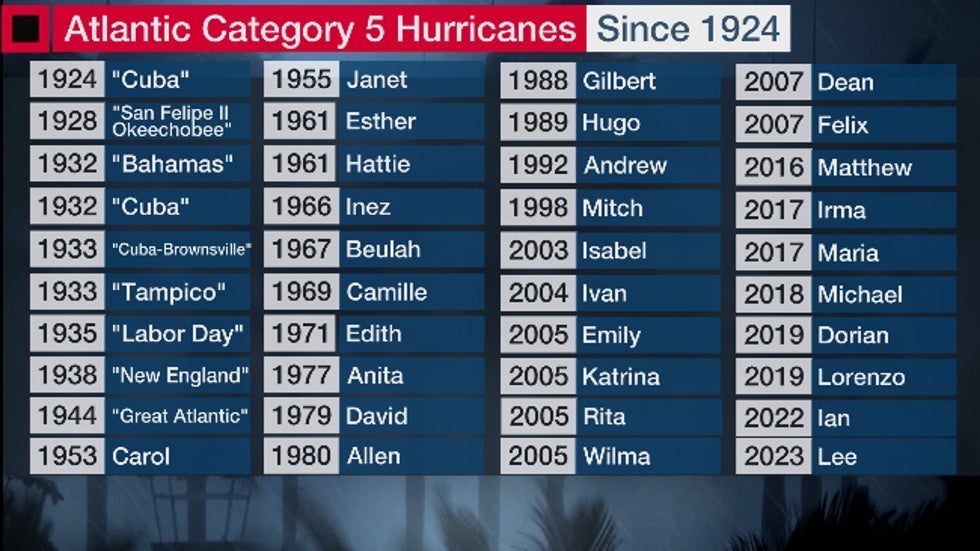
.
BBC customers would see that graph and naturally assume that hurricanes are getting stronger, (despite that weaselly qualification at the bottom). But prior to satellites and robust hurricane hunter aircraft, most Cat 5 hurricanes could only be identified as such at or close to landfall. And if we only plot these storms, we get a completely different picture:
Image may be NSFW.
Clik here to view.
https://en.wikipedia.org/wiki/List_of_Category_5_Atlantic_hurricanes
If anything, Cat 5 hurricanes were much more frequent at times in the past – notably the 1930s.
Since Dean and Felix in 2007, the only year with two Cat 5s, there have been just three – Irma, Michael and Dorian, in 2017, 2018 and 2019 respectively. Put another way, there have been just three in the past seventeen years.
This completely destroys the BBC’s deliberately misleading chart.
Andrew Hagen and Chris Landsea are two of the leading hurricane researchers in the US. Back in 2012, they published this paper, which looked at the issues surrounding the impact of changes in how we monitor hurricanes:
Image may be NSFW.
Clik here to view.
ABSTRACT
An investigation is conducted to determine how improvements in observing capabilities and technology may
have affected scientists’ ability to detect and monitor Saffir–Simpson Hurricane Wind Scale Category 5 hurricanes
in the Atlantic Ocean basin during the mid-twentieth century. Previous studies state that there has been an increase
in the number of intense hurricanes and attribute this increase to anthropogenic global warming. Other studies
claim that the apparent increased hurricane activity is an artifact of better observational capabilities and improved
technology for detecting these intense hurricanes. The present study focuses on the 10 most recent Category 5
hurricanes recorded in the Atlantic, from Hurricane Andrew (1992) through Hurricane Felix (2007). These 10
hurricanes are placed into the context of the technology available in the period of 1944–53, the first decade of
aircraft reconnaissance. A methodology is created to determine how many of these 10 recent Category 5 hurricanes
likely would have been recorded as Category 5 if they had occurred during this period using only the observations
that likely would have been available with existing technology and observational networks. Late-1940s and early-
1950s best-track intensities are determined for the entire lifetime of these 10 recent Category 5 hurricanes. It is
found that likely only 2 of these 10—both Category 5 landfalling hurricanes—would have been recorded as Cat-
egory 5 hurricanes if they had occurred during the late-1940s period. The results suggest that intensity estimates for
extreme tropical cyclones prior to the satellite era are unreliable for trend and variability analysis
https://journals.ametsoc.org/view/journals/clim/25/13/jcli-d-11-00420.1.xml?tab_body=pdf
Their map is particularly relevant – (RMW is Radius of Maximum Wind):
Image may be NSFW.
Clik here to view.
Apart from Andrew and Mitch, all hit Cat 5 speeds well away from land.
And they conclude that only those two of the ten hurricanes would have been classified as Cat 5s using 1940s technologies – Andrew, which hit Florida as Cat 5; and Mitch, which passed close to the north coast of Honduras.
Using 1950s methods, Felix would also have made Cat 5.
It is also worth noting that even though these three would have been called Cat 5s, the wind speeds estimated for 1940s technology were still less than officially recorded now. Mitch, for instance, is officially 15kts higher than the 1940s estimate.
Image may be NSFW.
Clik here to view.
Hagen & Landsea explain all of this very succinctly:
Image may be NSFW.
Clik here to view.
Note that Cat 4 hurricanes also have been understated in the past.
I have already complained to the BBC about their article, and in particular the graph. Will they ignore what the real hurricane scientists say?
I think we all know the answer to that!